The stocks mentioned here are for informational purposes only and should not be considered recommendations. Please do your research and analyze stocks thoroughly before making any investment decisions. Jainam Broking Limited does not guarantee assured returns or future performance of any securities or instruments.
Table of Contents
- Introduction
- Understanding the Shooting Star Candlestick
- Why the Shooting Star is a Reversal Signal
- Formation of the Shooting Star Candlestick in an Uptrend
- Shooting Star vs. Inverted Hammer Candlestick
- How to Identify a Bearish Reversal with the Shooting Star Pattern
- Trading Strategies Using the Shooting Star Candlestick
- Common Mistakes When Trading the Shooting Star Pattern
- Conclusion
Introduction
The shooting star candle stick pattern is one of the most powerful reversal indicators in technical analysis. It often appears at the end of an uptrend, signaling a potential bearish reversal. This pattern is widely used by traders to identify possible sell opportunities before a price decline.
A shooting star candlestick forms when an asset’s price rises significantly during the session but then closes near its opening price. This results in a small body at the bottom and a long upper wick, resembling a star in the night sky. The psychology behind this pattern indicates that buyers initially pushed the price higher, but sellers gained control and drove it back down, showing weakness in the bullish momentum.
Understanding the Shooting Star Candlestick
To recognize a shooting star pattern, traders look for these key characteristics:
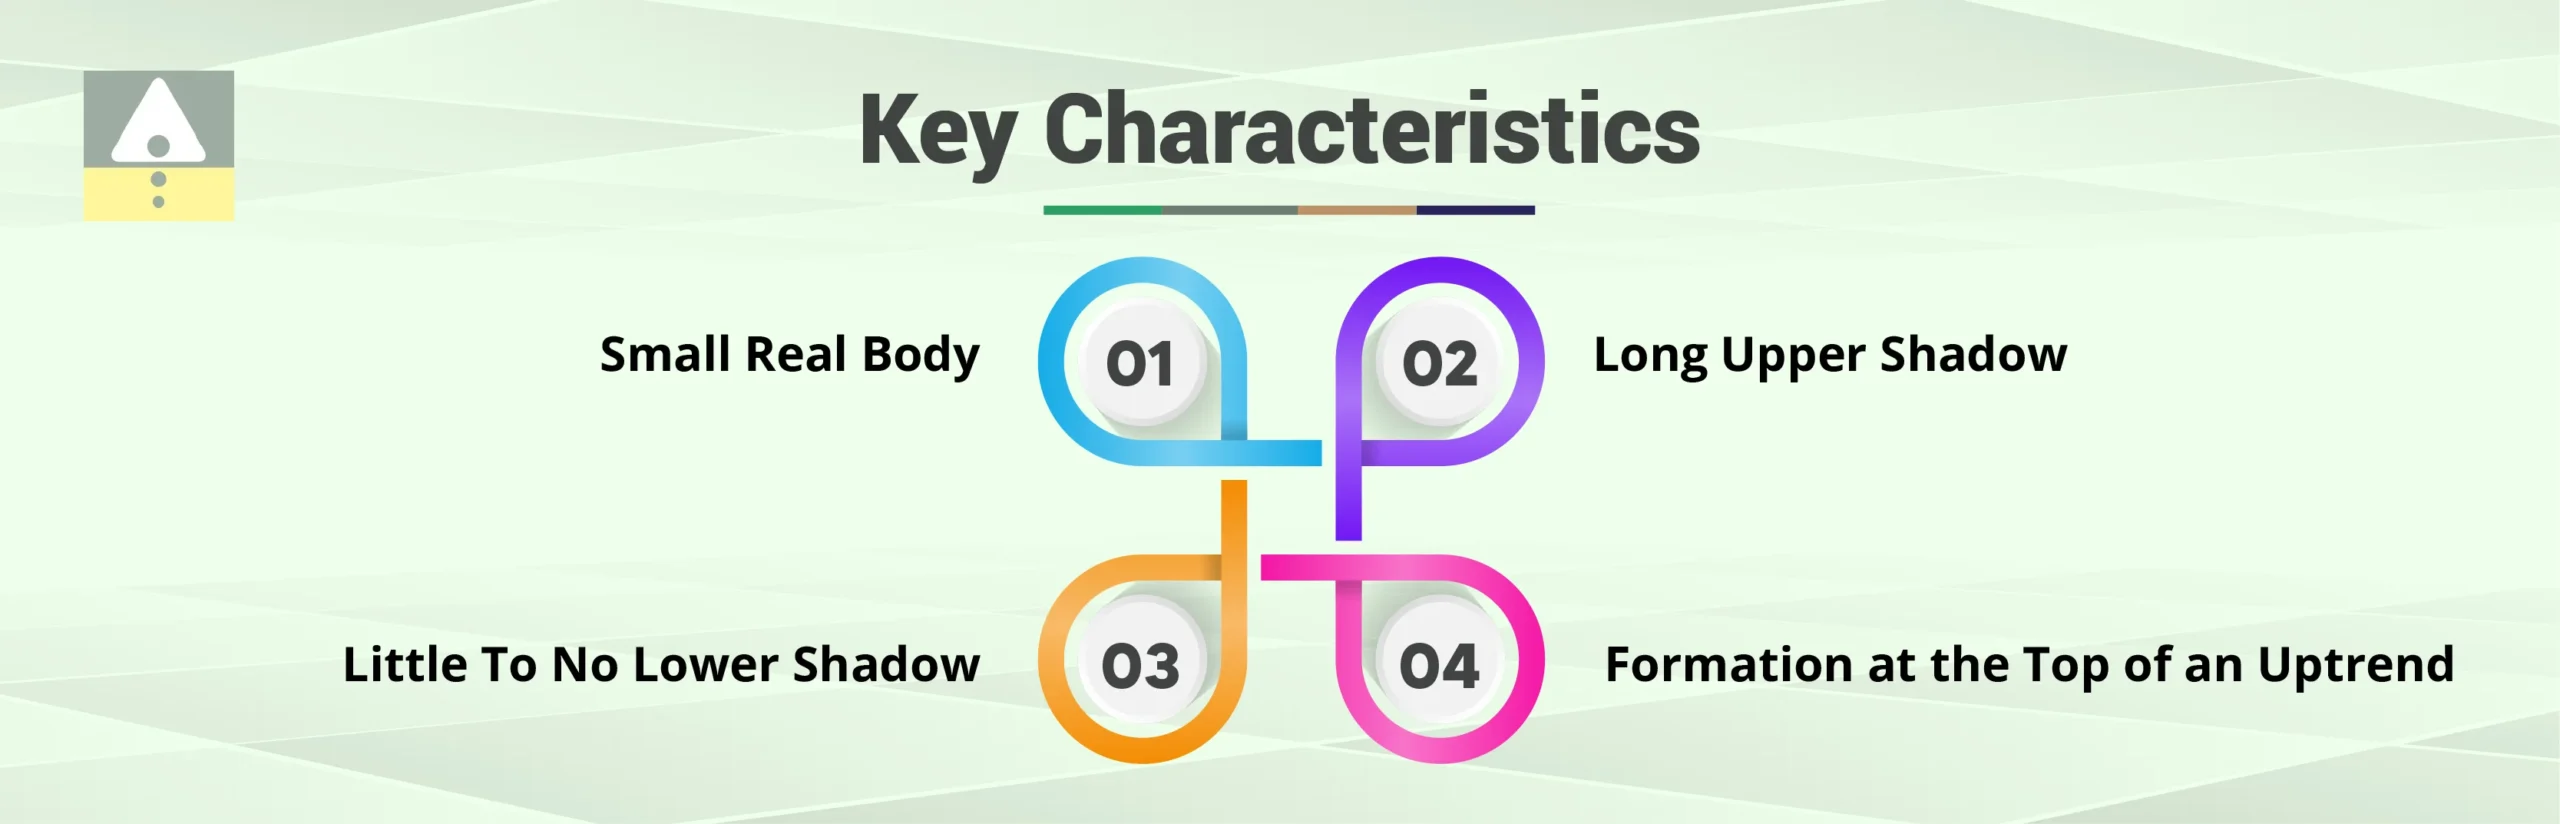
- A small real body near the low of the candle – This indicates that, despite the significant price movement during the session, the closing price was very close to the opening price, showing hesitation among traders.
- A long upper shadow that is at least twice the length of the real body – This reflects strong buying activity during the session that was eventually overpowered by selling pressure, leading to a sharp price drop before the close.
- Little to no lower shadow – The absence of a lower wick suggests that the price did not significantly drop below the opening level before moving upward, confirming the initial buying pressure.
- Formation at the top of an uptrend, indicating a reversal – The shooting star candlestick pattern typically appears after a prolonged uptrend, signaling a potential shift in market sentiment from bullish to bearish.
Why the Shooting Star is a Reversal Signal
The shooting star candlestick in an uptrend is often interpreted as a warning sign for traders. When the candle forms, it initially suggests strong bullish momentum as buyers push the price higher. However, the long upper wick tells a different story sellers stepped in with enough strength to erase most of the gains, leaving the closing price near the opening level. This shift in control from buyers to sellers hints at a potential trend reversal.
However, a real shooting star alone is not enough to act on. Traders often wait for additional confirmation before entering a trade. This confirmation could come in the form of:
- A bearish candle following the shooting star solidifies the downtrend.
- Increased trading volume, indicating strong market participation in the reversal.
- A break below a key support level, confirms that selling pressure is dominant.
Since not all-star candles guarantee a reversal, relying on additional technical indicators such as RSI (Relative Strength Index) and MACD (Moving Average Convergence Divergence) can help strengthen the bearish outlook. If the RSI is in the overbought zone and starts declining after a shooting star pattern, it further validates the potential reversal.
By carefully analyzing the context and confirmation signals, traders can effectively use the shooting star candlestick pattern to anticipate market shifts and make informed trading decisions.
You may also want to know the Difference Between Intraday and Delivery Trading
Formation of the Shooting Star Candlestick in an Uptrend
The shooting star candlestick in an uptrend is particularly significant. It emerges when an asset’s price has been rising, suggesting that bullish momentum may be slowing. This pattern provides traders with early indications that the uptrend may be losing strength and that a potential reversal could be on the horizon.
How It Forms:
- Opening Price – The price opens at a level close to the previous candle’s closing price, continuing the uptrend.
- Bullish Attempt – Buyers push the price higher during the trading session, creating a long upper wick.
- Sellers Step In – As the price reaches a peak, selling pressure increases, causing the price to drop back down.
- Closing Price – The session closes near the opening level, leaving a small real body at the lower end of the candle and a long upper shadow.
Market Psychology Behind the Formation
- At the start of the session, bullish traders dominate, pushing the price higher.
- As the price climbs, buying momentum weakens, and some traders begin to take profits.
- Bearish traders seize control, leading to a sharp decline in price before the session ends.
- The resulting shooting star pattern signals a potential shift in sentiment from bullish to bearish.
Why Confirmation is Important
The presence of a shooting star candlestick does not immediately mean the trend will reverse. Traders wait for confirmation signals before making trading decisions. These may include:
- A bearish candle follows the shooting star, indicating further selling pressure.
- Increased trading volume, supporting the idea that sellers are gaining control.
- A break below a key support level, confirms the trend shift.
- Indicators like RSI show overbought conditions, reinforcing the likelihood of a reversal.
When combined with these confirmations, the shooting star candlestick pattern becomes a valuable tool in identifying potential trend reversals and improving the accuracy of trade entries.
Shooting Star vs. Inverted Hammer Candlestick
While the shooting star candlestick and the inverted hammer candlestick patterns may look similar, they serve different purposes in market analysis.
Key Differences:
| Feature | Shooting Star | Inverted Hammer |
| Location | Found at the top of an uptrend | Found at the bottom of a downtrend |
| Signal | Bearish reversal | Bullish reversal |
| Wick Position | Long upper wick, little to no lower wick | Long upper wick, small lower body |
| Market Sentiment | Indicates sellers taking control | Suggests potential buying pressure |
The inverted hammer candlestick forms after a downtrend and suggests a potential reversal to the upside. It appears when sellers dominate early, but buyers regain control by the close of the session. This indicates potential bullish momentum, making it the opposite of the shooting star candlestick pattern.
How to Identify a Bearish Reversal with the Shooting Star Pattern
A shooting star candlestick pattern is effective in predicting bearish reversals, but traders must confirm the signal before taking action.
Confirmation Signals:
- Bearish Candle After the Shooting Star – A strong red candle following the star candle strengthens the bearish case.
- Volume Increase – Higher trading volume during or after the shooting star candlestick suggests stronger conviction among sellers.
- Resistance Level – If the pattern forms near a key resistance zone, it increases the likelihood of a price decline.
- RSI Divergence – If RSI (Relative Strength Index) shows overbought conditions and starts declining, it supports the reversal theory.
Many traders mistakenly assume that every shooting star pattern signals an immediate price drop. However, without proper confirmation, entering a trade based solely on this pattern can lead to false signals.
You may also want to know What Is a Bull Market and How to Invest in It
Trading Strategies Using the Shooting Star Candlestick
The shooting star candlestick pattern provides several trading opportunities, primarily for those who prefer short-selling or swing trading. Here are a few effective strategies:

1. Short Selling After Confirmation
- Identify the shooting star candlestick in an uptrend – Look for this pattern at key resistance levels or after a prolonged uptrend.
- Wait for a bearish candle to confirm the reversal – A strong red candle following the shooting star strengthens the bearish outlook.
- Enter a short trade below the shooting star’s low – This ensures the price is moving in the anticipated direction before entry.
- Set a stop-loss above the height of the shooting star – This minimizes risk in case of a false signal.
- Target previous support levels for profit-taking – These levels act as potential points where the price might stabilize or bounce.
2. Combining with RSI and MACD Indicators
- If the RSI is above 70 (overbought) and a shooting star pattern appears, it strengthens the bearish signal – Overbought conditions indicate a possible trend reversal.
- MACD crossover from bullish to bearish adds confirmation – A bearish MACD crossover signals weakening momentum.
- Enter the trade once the price moves below the shooting star’s low – This ensures the market confirms the anticipated downtrend.
3. Using Fibonacci Retracement Levels
- If the shooting star candlestick forms near a 61.8% Fibonacci retracement level, it increases the probability of a reversal – This level is widely recognized as a strong resistance area.
- Traders use Fibonacci levels to confirm the effectiveness of the shooting star pattern – If a shooting star aligns with a Fibonacci resistance level, it reinforces the bearish bias.
- This can be used as an additional confirmation before entering a trade – It helps in filtering out false signals and improves trade accuracy.
Common Mistakes When Trading the Shooting Star Pattern

1. Ignoring Confirmation Signals
One of the most common mistakes traders make is acting on the shooting star candlestick without waiting for confirmation. A single shooting star pattern may not always indicate a reversal. If a bullish candle follows the shooting star, it negates the bearish sentiment and suggests the uptrend might continue. Traders should always wait for a confirming bearish candle before making any trade decisions.
2. Confusing the Shooting Star with the Inverted Hammer Pattern
The inverted hammer pattern and the shooting star candlestick pattern look quite similar, which can lead to misinterpretation. However, the key difference is their placement within a trend:
- The shooting star pattern occurs at the top of an uptrend, signaling a potential bearish reversal.
- The inverted hammer candlestick pattern forms at the bottom of a downtrend and suggests a potential bullish reversal. Mistaking one for the other can lead to poor trade decisions, so traders must always check the broader trend before acting.
3. Placing Stop-Loss Too Close
Setting a stop-loss directly above the high of the shooting star pattern might cause premature exits due to price fluctuations. A slight retracement before a trend reversal is common, and a stop-loss placed too tightly might be triggered before the price moves in the expected direction. Instead, traders should consider setting a stop-loss a few points above the high to allow for market volatility.
4. Ignoring Market Context
The shooting star candlestick in an uptrend is most effective when it appears near a significant resistance level or in an overbought market condition. If there is no clear resistance nearby, the shooting star pattern may not hold much significance, and the uptrend could continue. Traders should always analyze key resistance zones, volume patterns, and overall market conditions before relying solely on the shooting star candlestick pattern for trade decisions.
Open free demat account in 5 minutes
Conclusion
The shooting star candlestick pattern is a valuable tool in a trader’s arsenal for spotting bearish reversals, especially at the peak of an uptrend. However, it should not be used in isolation. Confirmation through volume, support/resistance levels, and technical indicators is essential to validate the signal.
On the other hand, the inverted hammer candlestick plays a crucial role in identifying potential bullish reversals. Understanding the differences between these patterns helps traders make informed decisions and avoid common mistakes.
Mastering the shooting star pattern requires practice, patience, and an understanding of market conditions. By integrating this pattern with other technical tools, traders can enhance their ability to anticipate trend changes effectively and make smarter trading decisions.
At Jainam Broking Ltd., we provide expert insights and analysis to help traders navigate market trends confidently. Whether you’re new to trading or an experienced investor, our research and tools can support your journey toward informed decision-making and strategic trading.
Are you planning on trading in the stock market? If yes, you are at the right place!
Open a Free Demat Account with Jainam Broking Ltd. Now!
What is the Shooting Star Candle in Trading?

Written by Jainam Admin
2 users read this article
Frequently Asked Questions
What is the shooting star candlestick pattern in trading?
The shooting star candlestick pattern is a bearish reversal indicator that appears at the top of an uptrend. It has a small body near the low, a long upper wick, and little to no lower shadow, signaling potential selling pressure.
How does the shooting star candlestick signal a trend reversal?
A shooting star candlestick forms when buyers push the price up during a session, but sellers regain control and close near the opening price. This pattern suggests a weakening uptrend and possible bearish reversal.
What is the difference between a real shooting star and other star candles?
A real shooting star has a long upper shadow and a small body near the low, indicating a clear rejection of higher prices. Other star candle formations, like doji or morning star, may indicate different market sentiments.
How reliable is the shooting star candlestick inuptrend?
The shooting star candlestick in uptrend is highly reliable when confirmed by a bearish follow-up candle, high trading volume, and resistance levels. However, it should not be used in isolation.
What is the difference between the shooting star pattern and the inverted hammer pattern?
The shooting star pattern appears at the top of an uptrend and signals a bearish reversal, whereas the inverted hammer pattern forms at the bottom of a downtrend, suggesting a potential bullish reversal.
Is the inverted hammer candlestick pattern the opposite of the shooting star?
Yes, the inverted hammer candlestick pattern is considered the opposite of the shooting star pattern. It appears after a downtrend and signals potential bullish momentum, while the shooting star suggests bearish pressure.
What role does the bearish hammer play in trading decisions?
The bearish hammer is another reversal pattern that resembles the shooting star but has a longer lower wick. It is crucial in identifying potential downward price movements when confirmed by bearish follow-through.